Landscape Mosaic Demonstration Project
In the early 2000s, computer vision and photogrammetry algorithms were being developed that allowed for the automated assembly of mosaics thousands of seabed images. These new mosaics provided a landscape perpsective on the order of hundreds to thousands of square meters at sub-mm spatial resolution. Initial inspections of these products suggested that using these mesoscale, 2-D, mosaicked images of reef plots could circumvent the limitations of current state-of-the-art methods in coral reef monitoring (i.e., diver transects, photo-quadrats), while simultaneously maintaining the strengths of a diver-based approach. Testing this premise was the overall objective of a project sponsored by the U.S. Department of Defense Environmental Security Technology Certification Program (ESTCP).
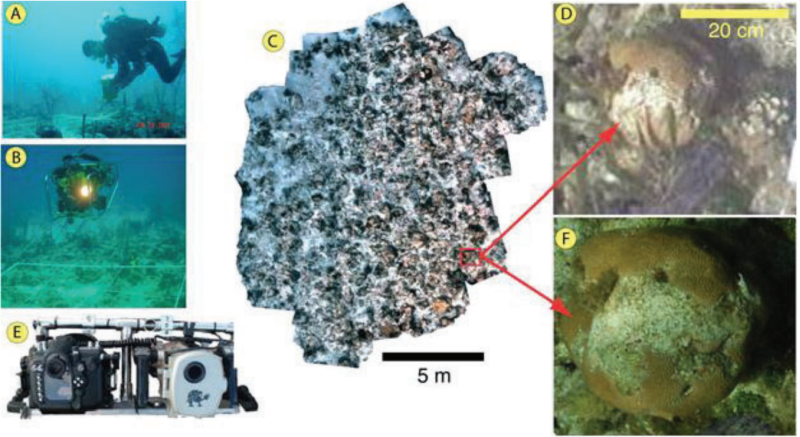
 Figure 1: Mosaic overview. Video images acquired by a diver (A) or other platform such as an ROV (B) are automatically stitched together to form a landscape mosaic (C) covering a large area (about 100 m2 in this case). First-generation mosaics (i.e. those produced with video only) have mm-scale resolution (D). In second-generation mosaics, still imagery is acquired simultaneously with the video (E) to achieve sub-mm resolution (F).
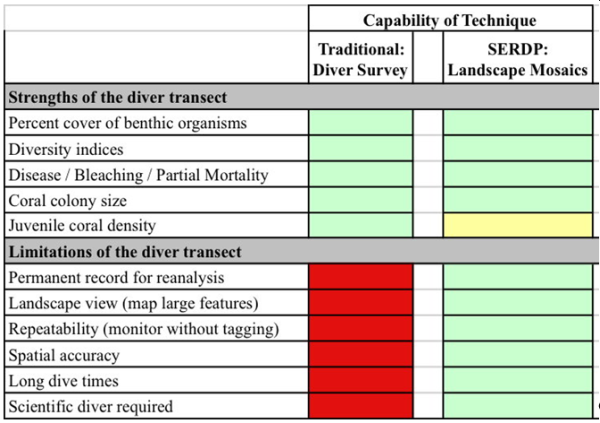
Traditional coral reef monitoring approaches depend on the experience of trained scientific divers to measure indices of reef condition underwater. This methodology, while excellent at providing metrics that are considered the “gold standard” of coral reef monitoring, does, nevertheless, suffer from some drawbacks (Table 1).
 Table 1: Comparison of the capabilities of diver-based methods and landscape mosaics for
coral reef monitoring. Green shading indicates full capability, yellow partial capability, and red poor
capability. The objective of this project was to demonstrate that mosaics retain the strengths but
circumvent the limitations of traditional diver-only approaches
In order to demonstrate the capabilities of the underwater landscape mosaic technology, the approach was to determine potential end users’ specific applications and needs that could benefit from these new capabilities. Five field demonstrations were conducted to test 18 performace objectives that had been identified in respose to the needs assessement. Most of the performance objectives had more than one metric to test, so there were a total of 57 metrics that were assessed during the project. Of the 18 performace objectives, 9 were considered completely successful, 9 were a partial success, and 0 were failures. Of the 57 metrics, 45 were considered completely successful, 12 were a partial success, and 0 were failures. Eight of the 12 metrics that were partial successes were technically not complete successes due to the way the performance tests were designed, but for practical purposes were still quite acceptable.
 ART GLEASON | Archive
 Project Executive Summary
 Project Final Report